Navigation:
- Freeware
- - Development
- - Other
- - UDAV
UDAV 0.7.1.2 freeware
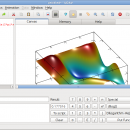
UDAV is cross-platform program for data arrays visualization based on MathGL library. It support wide spectrum of graphics, simple script language and visual data handling and editing. It has window interface for data viewing, changing and plotting. Also it can execute MGL scripts, setup and rotate graphics and so on. ...
| Author | Alexey Balakin |
| Released | 2011-06-01 |
| Filesize | 41 kB |
| Downloads | 415 |
| OS | Windows XP, Windows Vista, Windows Vista x64, Windows 7, Windows 7 x64 |
| Installation | Instal And Uninstall |
| Keywords | data visualization, MGL script, MGL manager, array, visualization, visualize |
| Users' rating (12 rating) |
UDAV Free Download - we do not host any UDAV torrent files or links of UDAV on rapidshare.com, depositfiles.com, megaupload.com etc. All UDAV download links are direct UDAV download from publisher site or their selected mirrors.
| 0.7.1.2 | Jun 1, 2011 | New Release | · New graphical user interface Major changes of FLTK version: · Update toolbar icons according with Qt version · Update "New command" dialog · New syntax highlighting (the same as in Qt version) · Help and list of variables is placed as tabs · Add buttons for find text and grid drawing · New MathGL help is used by default (the same as in Qt version) · Group errors messages in single window · Update animation parameters reading (the same as in Qt version) · Show position of the mouse click (like Qt version) · Data tables is placed as tabs now |
| 0.7.0.1 | Nov 17, 2010 | New Release | · Add templates -- usual script where %1...%9 can be substituted by user-defined strings. · Bugfix for reading textual data files (mostly under win32). · Bugfix for encoding of non-English documentation (trying to pass round Qt bug). |