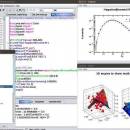
SCaVis 2.3 freeware

... environment for scientific computation, data analysis and data visualization designed for scientists, engineers and students. The program incorporates many open-source math software packages into a coherent interface using the concept of scripting, rather than only-GUI or macro-based concept. ...

Author Dr. Sergei Chekanov
Released 2015-03-18
Filesize 92.40 MB
Downloads 927
OS Windows XP, Windows Vista, Windows Vista x64, Windows 7, Windows 7 x64, Windows 8, Windows 8 x64
Installation Instal And Uninstall
Keywords data-analysis framework, data manipulation, data plotting, analyze, analysis, analyzer
Users' rating
(25 rating)
SCaVisCADWindows XP, Windows Vista, Windows Vista x64, Windows 7, Windows 7 x64, Windows 8, Windows 8 x64
Our rating 5 freeware award
SCaVis - visualization Freeware Download Notice

SCaVis Free Download - we do not host any SCaVis torrent files or links of SCaVis on rapidshare.com, depositfiles.com, megaupload.com etc. All SCaVis download links are direct SCaVis download from publisher site or their selected mirrors.

SCaVis freeware - The Latest User Reviews
SCaVis freeware - The Latest Versions History
2.3 Mar 18, 2015 New Release Bug in showing data in VHTable.
HTable was redone using the native java API
Vector graphics library was updated
Single-jar files were corrected
2.2 Jan 7, 2015 New Release A new canvas HPlotXY for interactive data drawings
Support for jplot2d package, including SVG and SVGZ file outputs
Added 40 Java and Jython examples
A bug in ScaVis IDE that prevent Java code for running was fixed
2.1 Nov 12, 2014 New Release Support for n-dimensional arrays like Numpy. The coding is based on ND4J and JBLAS. All matrix packages were moved to lib/math
Images can be exported to SVGZ (compressed vector graphics). Example: c.export("test.svgz")
Vector graphics output was redesigned. Now EPS, PS and PDF files have better quality since converted from SVG on the fly
Tools to convert between different image formats (for activated version)

Most popular CAD freeware downloads

SpliceGrapher

0.2.7 freeware download

... junction prediction using support-vector machines · splice graph visualization ...

MOPlot

1.93 freeware download

MOPlot is a handy visualization application specially designed for fast molecular orbitals plotting from the outputs of the Gaussian 03/98/94, Molcas, Gamess/US quantum chemical calculation ...

pCon.planner

8.9.0.100 freeware download

... The pCon.planner sets new standards in the graphic visualization of your planning. Move freely and in real-time ... use - Countless web catalogs - Breathtakingly realistic visualization - Optimal handling of data - Realistic, on-demand ...

MZmine

2.52 freeware download

... methods for each data processing task and data visualization. The project entered a second phase as Tomáš Pluskal of G0 Cell Unit at Okinawa ...

Gmsh

4.13.1 freeware download

... for academic problems with parametric input and advanced visualization capabilities. Gmsh is a portable piece of software which features a built-in CAD engine and post-processing ...

PyMCA

5.5.5 freeware download

... Toolkit is a collection of Python tools for visualization and analysis of energy-dispersive X-ray fluorescence data. It builds its graphic interface and plotting routines on ...

PyMCA for Linux

5.5.5 freeware download

... Toolkit is a collection of Python tools for visualization and analysis of energy-dispersive X-ray fluorescence data. It builds its graphic interface and plotting routines on ...

Gwyddion for Linux

2.66 freeware download

... modular program for SPM (scanning probe microscopy) data visualization and analysis. Primarily it is intended for analysis ... Gtk+ should be possible. FEATURES: · visualization: false color representation with different types of mapping ...

GiTools

2.2.2 freeware download

Gitools, is a framework for analysis and visualization of genomic data. Data and results are represented as browsable heatmaps. Gitools allows to import data directly ...

DSI Studio

.59 freeware download

... transform with mutual information as cost function. Visualization: · Real time 3D tractography presentation · Tracks ... cutting function · 3D Regions presentation · ODF visualization ...